Core Web Vitals is a set of metrics Google uses to evaluate the quality of your website. Optimizing your site for these metrics, including using caching plugins, is absolutely essential. Not only does optimizing these metrics and using caching plugins for a good score give your website a solid user experience (UX), but that user experience combined with a fast loading speed and high performance boost your search engine rankings, too. Basically, to do well regarding Google Page Speed Insights, your Core Web Vitals, including the use of caching plugins, need to be in tip-top shape.
Understanding Core Web Vitals
The first thing we should address is the definition of Core Web Vitals. This is what Google says they are:
Web Vitals is an initiative by Google to provide unified guidance for quality signals that are essential to delivering a great user experience on the web. [. . .] Core Web Vitals are the subset of Web Vitals that apply to all web pages, should be measured by all site owners, and will be surfaced across all Google tools. Each of the Core Web Vitals represents a distinct facet of the user experience, is measurable in the field, and reflects the real-world experience of a critical user-centric outcome.
In plainer English, Google has put together a set of metrics that are quantifiable and measurable that indicate the real-world experience of your website, rather than a simulated response in best-case conditions. They clump these together in what they’re calling page experience.
The most fundamental thing you need to understand about them is that if users find your site hard to use or frustrating, it doesn’t matter how good your content is. Google doesn’t want people to be frustrated.
Core Web Vitals are all about putting the users and their experience on your site first, not technical details.
What are the Core Web Vitals?
The actual Core Web Vitals that Google finds most important might change over time. As internet technology evolves, so do user expectations. At the moment, Google page speed insights and web vitals take the following metrics into account. Below, you will find brief overviews of all the metrics Google assesses, and we have provided links to detailed guides on gaining insight and understanding on measuring, optimizing your site, and maximizing your score for each one.
First Input Delay

First Input Delay (FID) is also known as Total Blocking Time and measures the time in milliseconds between the user’s first action and the browser’s response time. You may see on a number of site speed analyses an error that mentions “render blocking resources.” That’s what this refers to.
If you have a website loading certain scripts first, the entire website will stall and stop loading until that’s finished. Some elements cannot be loading simultaneously. When that happens, there’s both a block for new content to be displayed (render blocking), as well as user input (the browser and server communicate the input because processes are stalled or paused).
Google currently considers FID/TBT as the most important of the Core Web Vitals, and gives it 30% of the overall weight when determining your site’s Page Speed Insights score.
First Contentful Paint

First Contentful Paint (FCP) is when the very first DOM element is displayed, which is usually an image or text. This metric does not measure blank (or non-contentful) elements such as solid background colors or a blank canvas.
FCP is quite an interesting metric in that it doesn’t indicate overall site speed. It reflects the perceived site speed from the user’s perspective. FCP measures the time in which a user will see the first bit of your site pop up. When the user sees any site content appear quickly, their perception indicates a fast-loading site even if the rest of the site takes a bit longer to load.
Largest Contentful Paint

A site’s Largest Contentful Paint (LCP) is the time it takes for largest section of the viewport’s content to appear. Ideally, your largest chunk of content will appear before the rest of your website loads. This will not only indicate a low FCP, as we discussed above, but will also give the user something to occupy themselves with as other scripts and media load into the browser.
Usually, a hero section or sizeable chunk will make up the LCP. More than FCP, the LCP metric is a better quantifier of overall page experience for Google, and it should be one of the elements you focus on improving on your site before others.
Cumulative Layout Shift

Cumulative Layout Shift (CLS) is a measure of how much the website’s content shifts position above/below the fold as the page continues to load. If you have ever gone to a website and seen the images and buttons bounce around the screen and been unable to click what you intend to, that’s CLS. Elements on the site move around without your input, no scrolling, no clicking, no hovering. Things just move around on their own.
And it is a huge factor in page experience for Google. Having a constantly shifting interface is one of the most frustrating thing that can happen to a website user, causing misclicks, potential incorrect orders, and even simple frustration that leads to them abandoning the site.
Time to First Byte

Time to First Byte (TTFB) is an incredibly simple concept to grasp. It measures how long it takes the user’s browser to get (not render) the very first byte of information from the server. That’s it. Basically, TTFB is literally the moment the user’s browser hears the server say “hi.”
TTFB measures literally any information the browser gets back, visible or not. Contentful or not. While it’s not considered one of the highest priority core web vitals, you should pay attention to it because a low TTFB indicates a fast server response, which can be directly related to overall page load speed and interactivity. Which are high-priority web vitals.
Speed Index

Speed Index is a relative metric dependent on the user, measuring the time all content renders above the fold. Think of Speed Index as the quick view average of your site’s overall performance and UX. While it doesn’t go into specifics, a green/orange/red Speed Index score from Google Page Speed Insights is a sort of good/okay/bad rating.
Because Google weighs different Core Web Vitals differently (as we discuss below), having a great score in some and bad in others might not translate into a great page experience in Google’s eyes.
Which is the Most Important Core Web Vitals Metric?
Well, that depends. All of the Core Web Vitals are not equal, but to what amount shifts over time. Google’s Lighthouse software gives a weighted average for your Core Web Vitals, and the scores that make it up might shift in their importance as Lighthouse evolves. Some of the metrics have more of an impact on UX than others at different times.
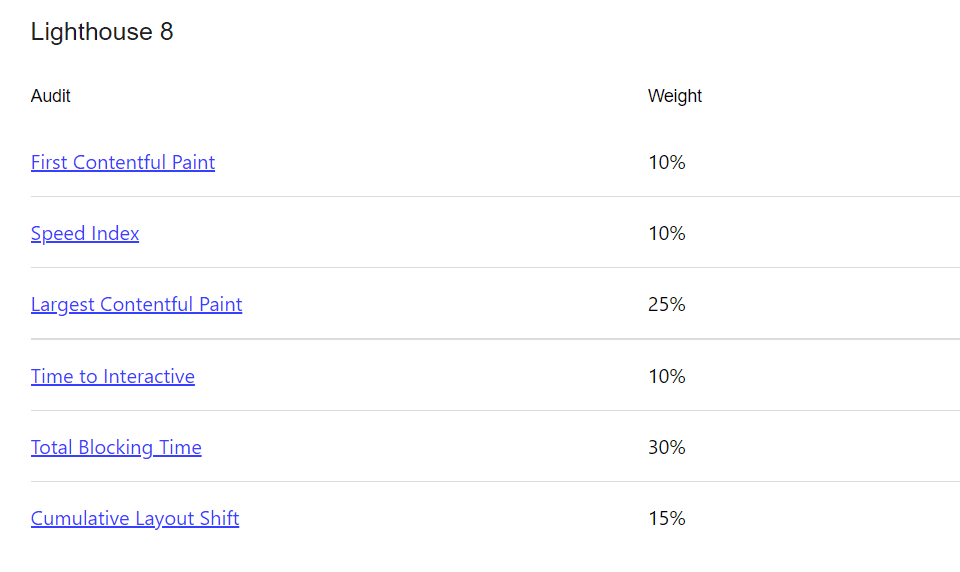
At the time of this writing, Lighthouse is on version 8. You can see its performance scoring in the image above or the text below in descending order:
- Total Blocking Time (30%)
- Largest Contentful Paint (25%)
- Cumulative Layout Shift (15%)
- First Contentful Paint (10%)
- Speed Index (10%)
- Time to Interactive (10%)
So to achieve the best score right now, you can focus on reducing render-blocking resources and ensuring quick loading for the largest piece of above-the-fold content. That will count more for your Core Web Vitals score than the other metrics combined. Which then boosts your page rank overall.
That won’t always be the case, and those weights will shift, but as of this writing, TBT/FID and LCP are the most important Core Web Vitals with CLS pulling close into third.
Takeaways in Plainer English
This may all seem very technical, but the concept really isn’t. Page experience using Core Web Vitals is balanced on three pillar elements:
- Site Stability
- Reaction and Responsiveness
- Speed and Performance
Or in even plainer English:
- Does the site shift and reposition elements as it loads?
- How quickly can the user interact with the site?
- How fast can the user see useful stuff?
These questions (regardless of their answers) can be dealt with by addressing cumulative layout shift, first input delay, and largest contentful paint, respectively.
What are Not Core Web Vitals?
As we said above, the basic idea is that Google can track real-world user experience. What that means, in reality, is that web developers and site owners need to shift their mindset away from simpler, more technical aspects. Google might penalize you in page speed insights for not having these. But they won’t reward you just for having them as they would have years ago.
These vital metrics do not include the old standbys of mobile-friendliness and responsiveness. At this point, Google just takes it as a given that your site is mobile-friendly and responsive. It’s important, but it is no longer top-of-the-list as it once was.
Same goes for SSL and making sure your site runs on HTTPS. With the ubiquity of free SSL certificates through hosts and services like Let’s Encrypt, having a secure site is no longer worth highlighting. It’s the default state of websites. No longer does Google boost pages just for being secure.
Google used to give you a bonus for not having an interstitial pop-up. Those are the full-screen email opt-ins that immediately loads as a user comes to your site. But as time has passed, the company is no longer rewarding you for not having obnoxious pop-ups. They’re going to slap you on the wrist for wasting your users’ time.
And this should go without saying, but you will not be boosted for having a Safe Browsing Experience on your site (i.e. no malware). In many ways, this is the lowest bar that can be set for a website to meet. There is no reward for not hurting your users, but there is a penalty.
How to Measure Core Web Vitals
Since Google has placed such a priority on user experience and your having optimized Core Web Vitals, they have a number of tools for you to use to measure your site and where it stands.
- Lighthouse is the underlying software that measures the core web vitals. It is integrated into other tools, but you can also run a straight Lighthouse audit to get the most information possible. It is the most technical of all the available tools, however.
- Google’s Page Speed Insights tool is probably the most well-known for measuring these, as it incorporates Lighthouse in a much more pleasant UI. It gives you a complete view of how Google sees your website, but we also suggest that you use other tools to gauge things, too. Page Speed Insights is known for being exceptionally harsh on even the fastest and most well-designed sites.
- Google Search Console is a different kind of one-stop shop for measuring Core Web Vitals. You get a page-by-page report on what individual pieces of content and URLs need to improve on and which vital is lacking (or not).
- GT Metrix and Pingdom Tools are third-party speed and performance tests that can give you insight into your Core Web Vitals. Because they don’t come directly from Google like the others we mention, you can see more real-world data and how users from different locations and using different technologies will see your site.
Conclusion
The primary takeaway is that the user comes first. Always. Whether it is with the content you create, the content they experience, or even their perception of the content they experience. How they see your site is more important than how you build your site. Admittedly, a poorly built and designed website will have low scores. So the technical aspects definitely matter. But it’s the end result of those technical decisions that Core Web Vitals focus on, not their mere existence.
Consider the best use of performance plugins for WordPress to make sure you are properly optimized for Core Web Vitals.
How do you feel about the current state of Google’s Core Web Vitals? Let us know in the comments!
Article featured image by BestForBest / shutterstock.com






Hello BJ, core web vitals has been a headache recently. I’ve been using caching plugins like WP Rocket and Assets Cleanup Premium to control the page speed along with OMGF Plugin and Ewww Image Optimizer. Despite my best efforts, I still get a bad score on the Web Vitals test. This happens when I activate the Google Adsense advertisements on my website that are the only way to monetize my site. So, if I disable Adsense, the score goes high but when I reactivate them, it’s just another headache. Do you have any idea to improve page speed on Google Adsense sites? Thanks in advance.
Google is winning users not only because it is a monopolist in many digital spheres but also because it gives them the best experience. Though it can bring more trouble for webmasters, in the end, the changes Google regularly introduces are for the greater good.
I wonder why Divi does not have a working youtube lazy-loading in place, yet. You could make a real impact for saving CO2 emissions … it would be so easy to bring in the iframe’s src-doc attribute holding the preview image (almost fully backwards compatible by using the same markup as of Today’s preview image) … instead of “only” overlaying the iframe(s), which luckily already only start loading on-screen (loading attribute).