Speed Index (SI) is an interesting metric when considering page speed. It is absolutely an indication of your page’s performance, but it is completely different from other user-centric metrics such as First Contentful Paint and Largest Contentful Paint. SI indicates how quickly your site loads above the fold. Or to put it another way, when all content within the user’s viewport is completely visible. When looking at your page’s load times, you’re not likely going to be penalized or rewarded for your Speed Index. That is no reason to ignore it. As a single metric, it’s one of the few that encompasses multiple other metrics and can give you a solid idea of your site’s overall speed, efficiency, and performance.
Subscribe To Our Youtube Channel
What is Speed Index?
Lighthouse, Google’s backbone for PageSpeed Insights, looks at multiple performance metrics to grade your site. Speed Index (SI) is one of those, and the report will display the time in seconds rather than milliseconds as with some other metrics. Google defines SI as “how quickly the contents of a page are visibly populated.”
Pretty straightforward, right?
Speed Index does not take into account back-end scripts or other non-painted loads. They do affect it, though. SI is simply a measure of how long it takes for users to see your content in full. That’s the kicker. In full. While other metrics such as LCP are measured in when the largest portion of the content is displayed, Speed Index accounts for any and all content that should be displayed actually is.
This is not a measure of overall page speed. That takes into account when the browser renders all elements. Including non-visible scripts and elements that affect performance. However, if you want a good gauge of when your users perceive the page to be fully loaded, SI is the metric to watch. Because of how user-centric it is, SI can be a good indication of overall site health as well as a baseline for your site’s user experience (UX).
How to Measure Speed Index
As with most site performance metrics, one of the top tools to use is Google’s own PageSpeed Insights. This tool is one of the most particular in the results it returns, too. It is relatively critical of even the most well-put-together sites. PageSpeed Insights most often gives lab data for your site, based on an aggregate of the past 28 days of collection. However, if you have enough visitors who relay information back to Google via Chrome, you can get real-world field data from the report, too. Not every site can get this, though.
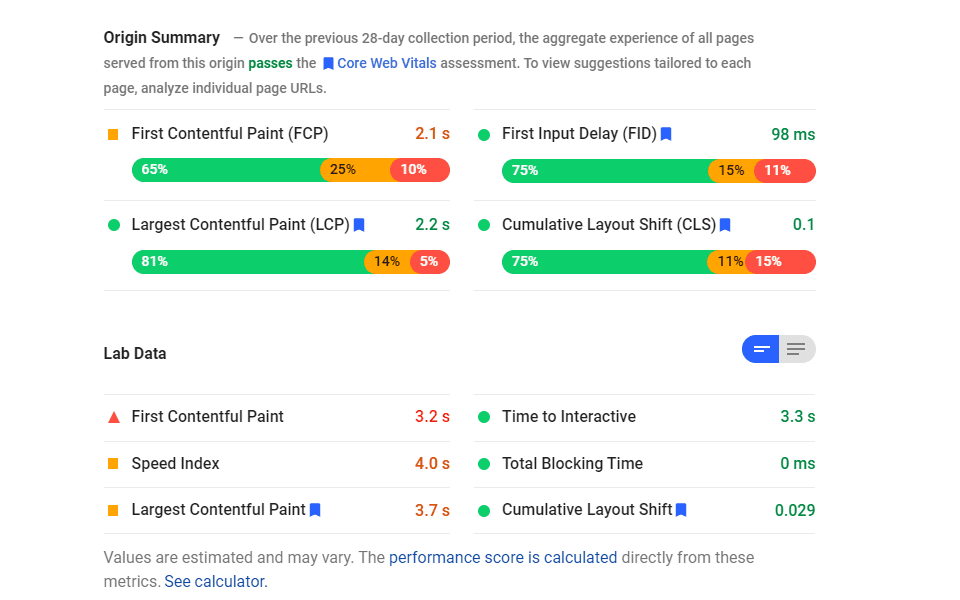
As you can see, the speed for many of these metrics are in the green. This indicates they are “good.” This is obviously where you want your site. However, Speed Index is 4.0 seconds and orange. That’s a long time for the user to wait to see everything above the fold.
What is a Good Speed Index Score?
PageSpeed Insights uses the following scores to rank your site’s Speed Index and color code it accordingly:
- Green (Good) – 0 to 3.4 seconds
- Orange (Moderate) – 3.4 to 5.8 seconds
- Red (Slow) – over 5.8 seconds
As we said before, PageSpeed Insights is very critical in its measurements. If you’re in the orange or red, you might want to use a tool such as GTmetrix or Pingdom’s Speed Test to see what their real-time data shows. We feel it’s best to test your site using multiple tools at different times to get the best picture of overall performance.
How to Optimize Your Speed Index Score
You can take a number of steps to optimize your Speed Index score. If you’ve ever tried to optimize your site for any sort of page speed increase (or, technically, decrease), then you have likely in some way affected your SI score, too. We are going to show you a few ways to specifically target your SI time so that your page loads as quickly as possible to give your visitors the best experience possible.
Reduce Render Blocking Resources
More specifically, reducing your JavaScript execution time is one of the top ways to increase your Speed Index score. Render blocking resources are scripts and code that prevent other parts of your website from loading by taking precedence. Instead of the site loading different elements concurrently, some elements pause all others until they’re finished.
And that lowers your site’s Speed Index. To get around this, you can defer any number of scripts and bits of code that load until after the visible elements have painted to the DOM. Identifying the culprits is actually relatively easy, as you can use the Chrome Dev Tools to take a look at your site as it loads, and the tool will indicate what is halting elements from rendering.
Additionally, WordPress users can use a caching plugin (or site optimization plugins) such as W3 Total Cache or WP Rocket to handle this. Often these plugins have a simple toggle to defer render-blocking resources.
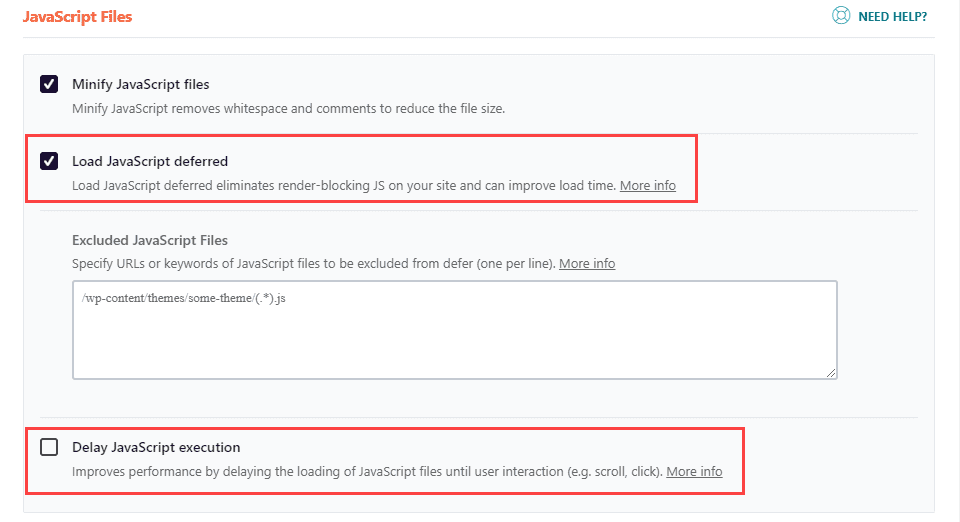
Divi users, too, have a major advantage for blocking such resources, as the theme options allow you to toggle render-blocking CSS deferral, as well as jQuery scripts. On top of that, the theme’s Critical CSS features break up large chunks of code that can delay your site’s content and cause them to load much more quickly than they otherwise would. While some of these are toggles, Divi automatically enables others. Installing Divi should help your SI score immediately in most cases.
Reducing Your Site’s Main-Thread Work
Like render-blocking resources, you can bottleneck the performance of your site by loading different elements that take up a lot of processing power from your server. Reducing those can help push the site to the browser more quickly.
The simplest solution for this is to stop using so much JavaScript. GTmetrix puts it best:
In general, the more JavaScript your page has, the longer the parse/compile process; resulting in a longer wait for users to view content and interact with your page.
We recognize this might not be easy. You have designed the site to function a certain way. However, there might be unused code that you can excise, and you might be able to optimize any third-party JavaScript you’re loading into your site. Also, minify your JavaScript.
On top of the JS audit, make sure that you minify your CSS and HTML. This will alleviate even more main-thread strain. Caching and optimization plugins often have these options, too.
Divi users, once again, have a leg up here, as the theme automatically minifies and splits CSS and JavaScript into bite-sized chunks for faster throughput, eliminating the need for tons of focus from your main-thread.
Speed Index Frequently Asked Questions
Speed Index is a simple concept that has complex ramifications. We want to answer some frequently asked questions about SI to help you optimize your website as well as you can.
How Does Speed Index Fit into my Website’s Overall Performance?
Speed Index, as a single metric, is a very good indication of your website’s performance in a number of different areas. Because it takes into account fully visible, above-the-fold content, you can use it as a gauge for not only user perceived loading, but also a rough estimate of what your site is doing in a number of different areas.
It actually doesn’t give you a lot of information on its own in terms of what your website is doing. It can be seen as a catch-all metric that, makes for, as GTmetrix puts it “a useful overall benchmark for assessing your website’s performance in its entirety.”
Should I Focus on my Speed Index Score Specifically?
Probably not, no.
While it is very useful to benchmark your site, focusing on other, more granular issues such as First Contentful Paint (FCP), Largest Contentful Paint (LCP), Time to First Byte (TTFB), and First Input Delay (FID) are much more important. You can take any number of steps to improve those individually, which will in turn improve your Speed Index. And when taken as an overall benchmark, you can see how well your optimizations are working through SI.
Conclusion
Page speed optimization is a never-ending battle that website owners fight. You have to strike the balance between usability, experience, and performance, and finding that balance can be difficult. When tests return so many different scores on so many different elements, it can be hard to know where to put your energy and resources. Speed Index can help with that, as a single metric that shows you how well your site is doing as you adjust other, more specific parts of your site’s performance.
What have you done to optimize your website’s Speed Index over the years?
Article featured image by HappyDrawing / shutterstock.com






Interesting article, hope learn as much as possible from this because this is serious goal for every website out there
Marketing is my specialty and I’m not that technically savvy when it comes to things that need to be fixed as shown in Google’s Page SpeedInsights.
What website places are good to go to and ask for help, Fiverr, Upwork, maybe. Other better ones you have had good service from?
I would be interested to see if there are any options with the LiteSpeed Cache that should be disabled in favor of the new Divi performance options.
Any Idea about how to reduce WP user registration spam?
We have a few ways that work against that in our Brute Force Attacks post, https://www.elegantthemes.com/blog/resources/how-to-protect-your-wordpress-website-from-brute-force-attacks. Things like moving the registration page away to a different URL than default and maybe using reCAPTCHA for registration. Plugins such as Loginizer can also help with that, too, depending on exactly how you have the registration set up.
You can use the CAPTCHA plugin.
Wow! My site got a horrible rating of 41 with SO many issues. I don’t even know where to start.
I’ve been there. Take a look at the other posts in our performance cluster here (use the search feature to find the ones about FCP, LCP, FID, TTFB, and CLS). Pick one particular score and work on getting that one in a better place, then move on to the next. A lot of the same tactics can affect multiple scores, so tackling your Time to First Byte (TTFB) can also make your FCP and LCP (First and Largest Contentful Paints) happen quicker. It can be intimidating, but luckily it all ties together so well that even small efforts can make big impacts on it.
Also, the new Divi update should be able to help a lot in some of these scores, so if you haven’t updated to the newest version, give that a shot for sure.
Thank you for the performance update. I currently have my own SiteGround Hosting, all of my sites use Divi and SiteGround Optimizer. Are there certain Cache options I should turn off or on? I used to use WP Rocket, would that be better ten the SG Optimizer. Some of my sites use 3rd Party plugins that slow things up.
I’m personally a big fan of WP Rocket, as that’s what I use. I haven’t had to touch my WP Rocket settings since updating personal sites to the new Divi version and went from an 86 to 99 on GTmetrix. It’s been a while since I tweaked SG Optimizer, so I can’t speak to that one at all.
Thanks for your huge performance update! I have tested it with Google PageSpeed according to your description here and I now get a score of 98 for mobile and 100 for Desktop! Thanks!